What is disaster risk?
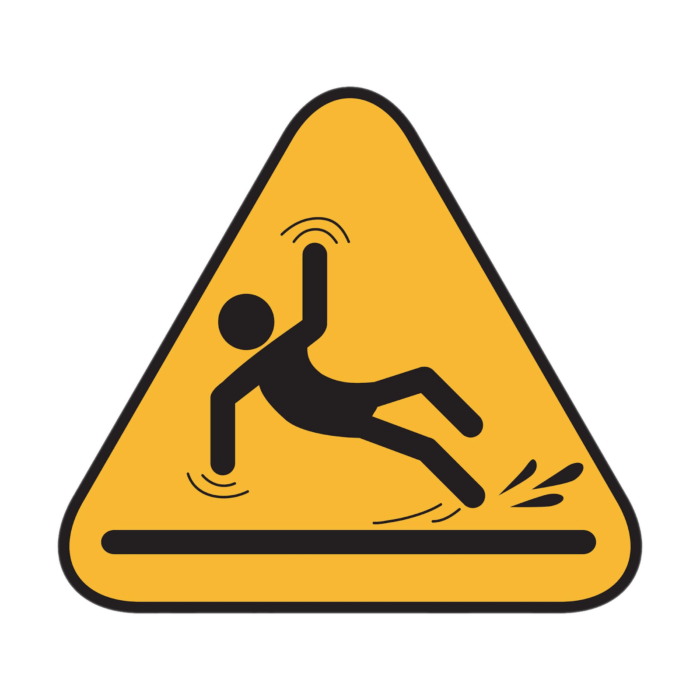
Risk can be hard to see in the world around us. Sometimes it might look like a wobbly ladder or ice on the sidewalk. When it comes to disasters, risk is often invisible on a day-to-day basis. Walking around the neighborhood, it’s hard for the untrained eye to see where a flood might happen, or identify what could get damaged during an earthquake.
Risk is a combination of three components: hazard, exposure, and vulnerability. Data from each of these categories can be used to paint a picture of risk in a certain location and over time.
Hazard – a potentially destructive physical phenomenon (e.g., an earthquake, a windstorm, a flood). Common natural hazards include floods, volcanic eruptions,, hurricanes, drought, tsunami, landslides, and more.
Exposure – the location, attributes, and value of assets that are important to communities (people, buildings, factories, farmland, etc.) and that could be affected by a hazard.
Vulnerability – the likelihood that assets will be damaged/destroyed/affected when exposed to a hazard. For example, a building with multiple floors may be more vulnerable to shaking from an earthquake and more likely to collapse than a one-story building. Another example, an elderly person may be more vulnerable to the impacts of flooding because s/he has a harder time evacuating or moving quickly.
Examples of risk data
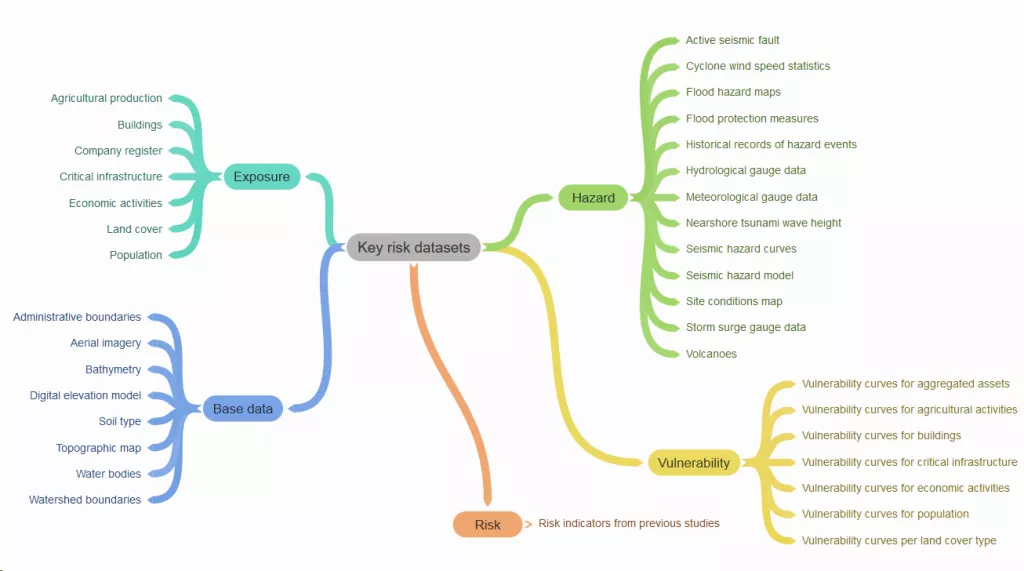
This graphic illustrates many of the types of datasets used to determine risk, many of which are geospatial and can be represented on a map. In many places around the world, these datasets do not exist, are not accessible, are incomplete, or are outdated, which makes them less valuable. GFDRR works with many countries to improve the quality, completeness, and access to open risk data.
Why is it important to understand and communicate risk?
Risk information is the foundation for good disaster risk management, which is how communities and governments protect people and property from natural hazards. Risk information helps tell the story of what, when, and where a disaster might happen, how severe it could be, and who would be most affected. If we don’t understand risk, we can’t manage it.
But it’s not enough to have the data. The data must be used and communicated in a way that allows decision makers — whether they be an individual member of the public, a government official, or anyone in between — to understand the science and risk information, and act upon it.
As an example, city planners have to understand risk, or else they could accidentally make decisions that increase risk and place more people in harm’s way. This can happen when housing developers are allowed to build in floodplains, or when building codes are not enforced. That’s where risk communication becomes vital. If we can illustrate how a piece of land that seems safe today might not be in a few years, we can keep more people’s homes out of high risk areas.
Historically, the world has suffered immense losses from disasters and spent a lot of money on response, recovery and rebuilding. But what if we didn’t lose so much every time an earthquake or hurricane hits? Communicating risk makes this possible. We know that one dollar spent on disaster mitigation is worth about $6 in response. So it really pays off to understand risk.
Visualizations are an excellent way to communicate information in an engaging, understandable, and accessible way. This is especially true for disaster risk data. Visualizing risk (in a way that’s relevant to your audience) can help people see their cities and communities as they never have before.
Where can I find risk data?
Now that you know what risk data are, where can you find them? We recommend starting with these open databases and tools:
- ThinkHazard.org is a starting point for understanding natural hazards in a location. Search for almost any location in the world and see a ranking of hazards, and download the underlying data.
- OpenDRI Index of open datasets for risk that have global coverage.
- GFDRR Labs GeoNode hosts all the data represented in ThinkHazard!
- HOTOSM Export tool or Overpass Turbo for downloading OpenStreetMap data, including building footprints and characteristics, road networks, areas of interest, and more.
- Humanitarian Data Exchange (HDX) – search by location or specific disaster event (such as Cyclone Idai) to find a compilation of humanitarian data.
- World Bank Data for socioeconomic information worldwide.
- Index of all known GeoNode databases.
So, are you up for the challenge? Your data storytelling and interactive maps could help people understand when, where, and how natural hazards might impact a location, encouraging them to learn more and reducing future losses.
Further reading on understanding risk and risk communication:
- Making a Riskier Future: How Our Decisions Are Shaping Future Disaster Risk
- Disaster risk reduction & disaster risk management (a primer)
- Design for Impact Framework: Integrating Open Data and Risk Communication for Decision-Making
- Aftershocks: Remodelling the Past for a Resilient Future
- Understanding Risk in an Evolving World: Emerging Best Practices in Disaster Risk Assessment