UR Caribbean Art: Tableaus, Timelines, Palm trees, Bush Tea Plots, and Benches
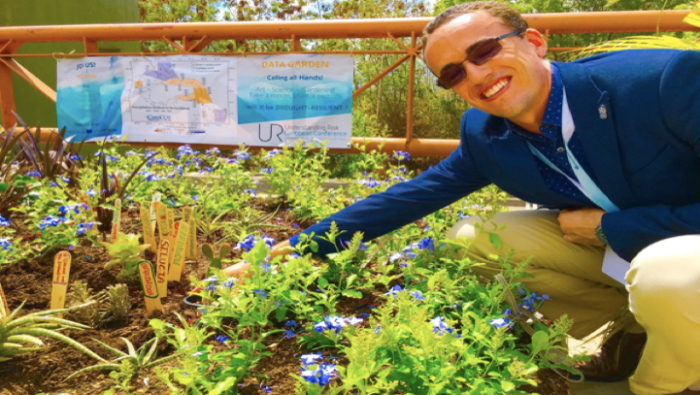
Kathy-Ann Caesar, of CIMH, helps add to the seasonal forecast plot of the DataGarden.
Arlene Laing, Coordonating Director for the Caribbean Meteorological Organization helps with planting in the DataGarden.
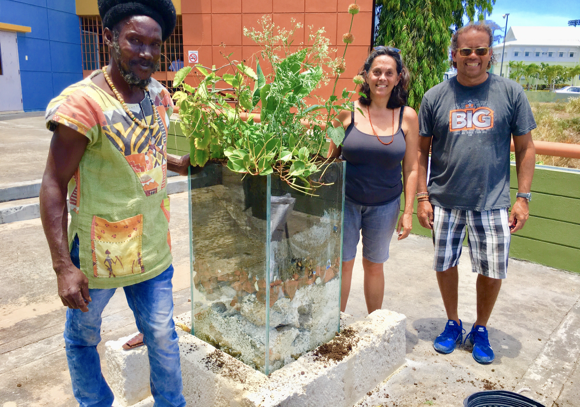
The CARICOF DataGarden, illustrating a seasonal rainfall forecast.
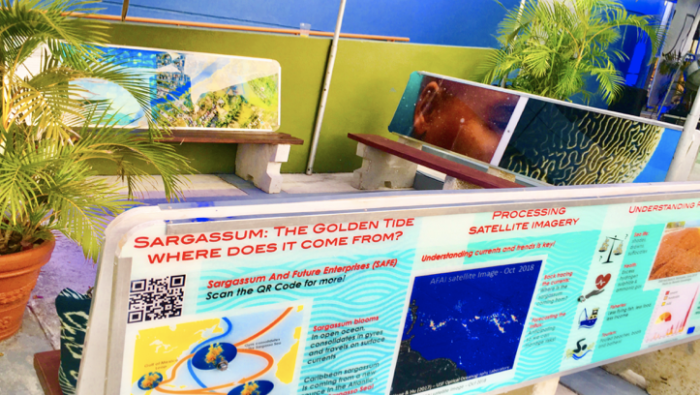
DataStory Benches: illustrating sargassum, coral, and vulnerability mapping.
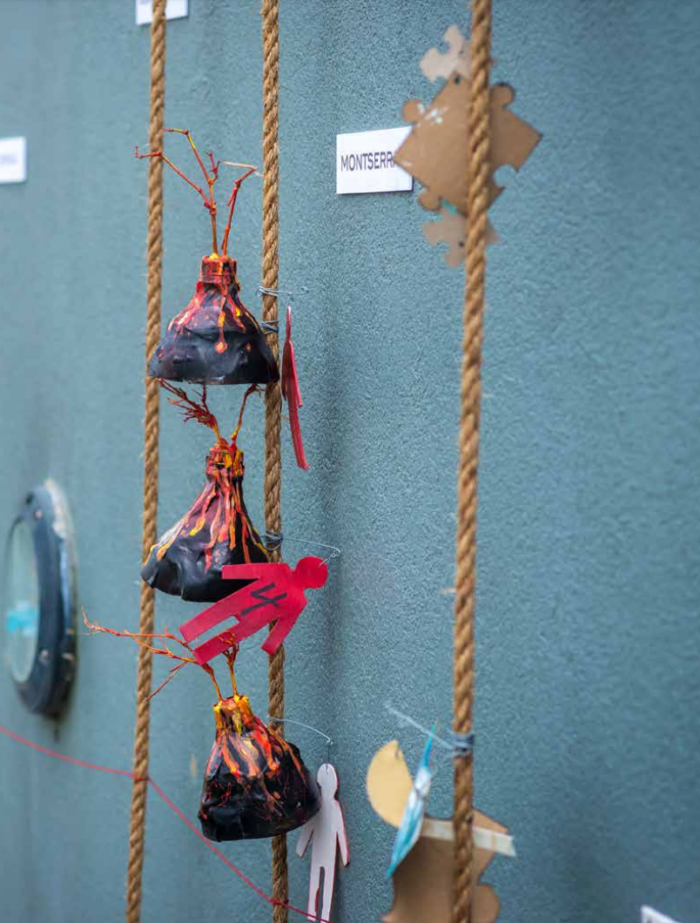
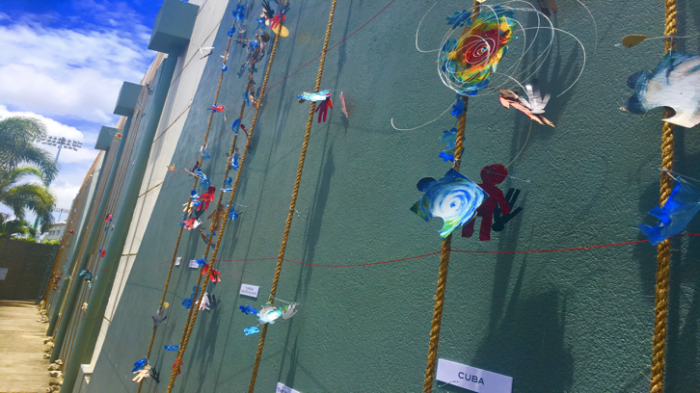
Risk Visualization was integrated with palm trees to illustrate disaster risk timelines.
Art Timelines: linking extreme events, impacts and financing.
Math art, representing a fractional hurricane. By: Nick Mendler
Bush Tea Plots, a decolonial patch.
Data Sculpture on Caribbean tourism landings before and after a major hurricane.
“Risky Timelines” data sculpture and contributor, Alanis Forde.
“Risky Timelines” data sculpture and contributor, Kia Redman.
“Risky Timelines” data sculpture and contributors, Akilah Watts and Alanis Forde. Note: Other artist contributions included Anna Gibson, Kraig Yearwood and Nadia Huggins.